TESCAN
menu
en

High-Resolution 3D Reconstruction of Human Oocytes Using Focused Ion Beam Scanning Electron Microscopy

High-Resolution 3D Reconstruction of Human Oocytes Using Focused Ion Beam Scanning Electron Microscopy

TESCAN’s SEMs help with pioneering research in reproductive medicine. In the first study investigating the ultrastructure of human oocytes in 3D, FIB/SEM tomography gave an unprecedented view of ooplasmic architecture. Researchers were able to explore spatial relationships between intracellular components and track structural changes associated with cytoplasmic maturation in oocytes in various developmental stages using TESCAN’s AMBER, AMBER X, and SOLARIS X instruments. The findings are highly significant for reproductive medicine and demonstrate the potential of large volume electron microscopy to study rare and delicate samples such as female gametes.

“High-Resolution 3D Reconstruction of Human Oocytes Using Focused Ion Beam Scanning Electron Microscopy,” published on November 2 in Frontiers in Cell and Developmental Biology by Zuzana Trebichalská¹, Jakub Javůrek², Martina Tatíčková¹, Drahomíra Kyjovská³, Soňa Kloudová³, Pavel Otevřel³, Aleš Hampl¹ and Zuzana Holubcová₁,₃*

¹ Department of Histology and Embryology, Faculty of Medicine, Masaryk University, Brno, Czechia

² TESCAN ORSAY HOLDING, a.s., Brno, Czechia

³ Reprofit International, Brno, Czechia

Read it here.
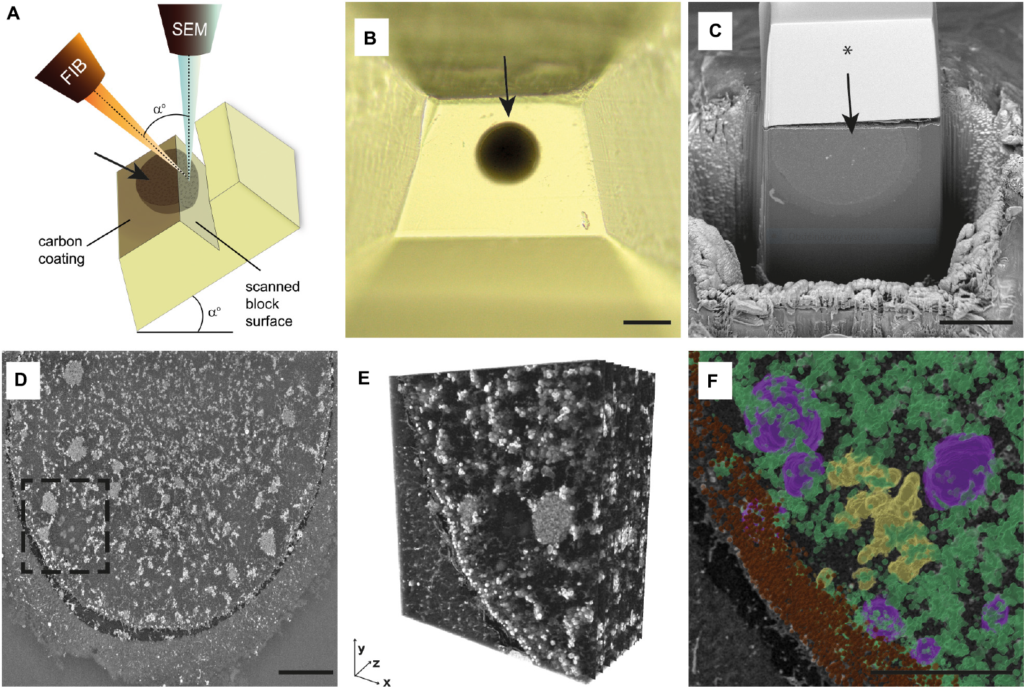
Overview of FIB-SEM imaging procedure and data processing. (A) The scheme of FIB-SEM setup. Both focused ion beam (FIB) and SEM (scanning electron microscope) columns are positioned in the microscope chamber, aiming at the scanned block surface’s coincidence point. The stage tilt corresponds to angle (a) between FIB and SEM column. The top of the surface of the resin block is coated with a carbon layer. Oocyte position is indicated with an arrow. (B) The top view of trimmed resin block with the sample embedded (arrow). (C) The trenched resin block with half of the oocyte (arrow). The block’s surface was coated with a thin carbon layer, and a silicon mask was placed over the sample (*). (D) The single grayscale image of MII oocyte surface scanned using FIB-SEM. (E) The 3D reconstruction of the spindle area [dashed rectangle in panel (D)]. (F) The 3D segmented and pseudocolored chromosomes (yellow), mitochondria (green), tubular endoplasmic reticulum (magenta), and cortical granules (brown) in the spindle area [dashed rectangle in (D)]. Scale bar: 100 µm (B), 50 µm (C), 10 µm (D,F).

16.11.2021