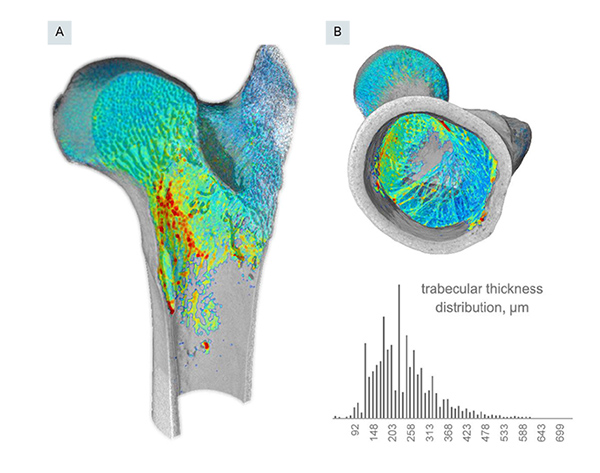
Quantitative analysis of trabecular thickness using the volume-thickness mapping method. Panels A and B show different virtual sections of the interior of the metaphysis. A histogram is shown in the inset. Note the general homogeneity of the strut thicknesses within the trabecular fabric. The centre of the thickness distribution is around 200- 260 μm, which is fairly close to the computed Tb.Th mean of 256 μm.
By using the UniTOM XL, high-contrast images of an entire sheep femur can be combined with trabecular analysis to obtain quantitative results. The obtained results can improve the understanding of the biomechanical significance of form-and-function relations in the bone.
Would you like to know more information? Download our Application Note.