As we consider new alternative materials for modern infrastructure design, we need to take lessons from our Roman ancestors and look beyond mechanics as the key indicator of success. Ancient Roman constructions have lasted for millennia in a variety of harsh environments, and their extraordinary durability can be associated with their widespread use of concrete, also known as opus caementicium.
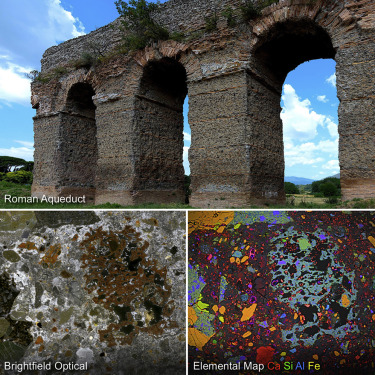
The TESCAN VEGA SEM was used in a recent study of these constructions. Using representative samples collected from Rome and Pompeii, researchers demonstrate that the resultant mortar consists of a hybrid binder, containing both C-A-S-H and calcite, and provide evidence of post-pozzolanic processes. While the use of recycled ceramics resulted in mortars that produced less C-A-S-H compared with volcanic ash mortars, it was still selectively chosen for freshwater infrastructure applications throughout the empire due to its extended workability, and numerous examples remain intact today.
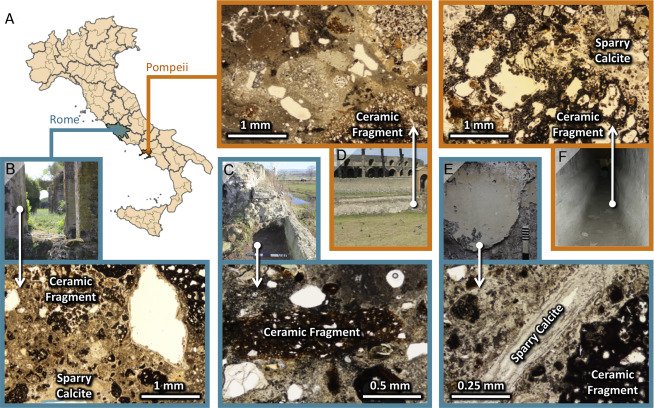
Figure 1. Samples containing crushed ceramics collected from a variety of ancient water infrastructure features in the vicinity of Rome and from the Pompeii archaeological site
(A) Map of Italy indicating the two regions from which our Roman mortar samples were collected.
(B–F) Photographs of the collection localities and representative petrographic thin sections from (B) cisterns of the Baths of Caracalla, (C) the Aqua Alexandrina/Antoniniana, (D) the Palestra pool in Pompeii, (E) an aqueduct near via Fragole in Rome, and (F) the aqueduct channel serving Pompeii.
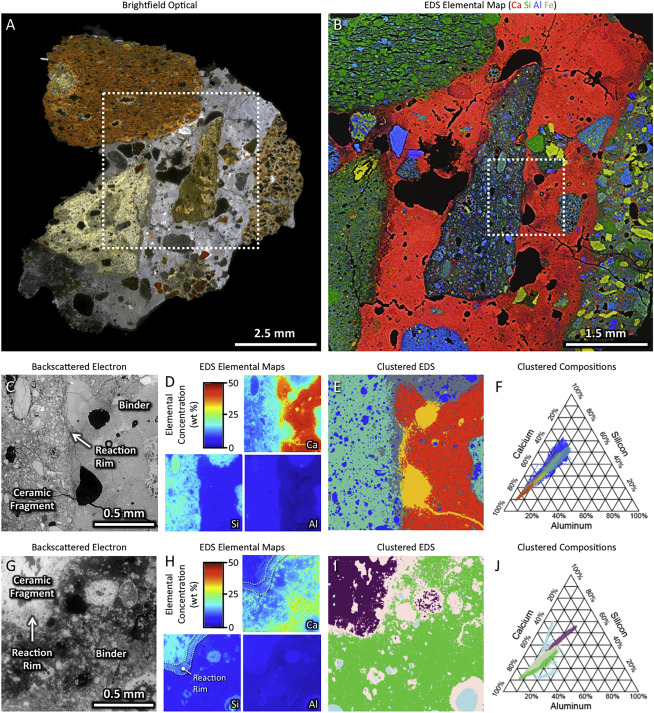
Figure 2. Elemental and chemical imaging of aquatic infrastructural mortars reveals the interfacial reaction rims of the ceramic fragments
(A) Large-area optical micrograph showing the compositional complexity of the mortar samples, in this case from an aquatic pool at the Pompeii archaeological site.
(B) Large-area EDS elemental map from the dotted region in (A), clearly highlighting the elemental heterogeneity of these complex mixtures.
(C) BSE micrograph from the dotted region in (B), revealing a darker thin reaction rim at the surface of a ceramic fragment.
(D) EDS map of the same area in (C), showing the calcium-rich binder surrounding the ceramic fragment.
(E) Clustering of the quantified EDS data reveals the interfacial zone of the ceramic fragment (shown in gray) has a distinct composition from both the binder and the interior of the ceramic fragment.
(F) The elemental composition of the clusters in (E) plotted on a Ca/Si/Al ternary diagram for comparison.
(G–J) The analysis from (C)–(F) repeated on a sample from an aqueduct near Rome, revealing similar compositions in both the ceramic fragment and its interfacial reaction zone. In this particular sample, the reaction rim, denoted by the dotted lines in the Ca and Si elemental maps in (H), is significantly thicker than the example shown in (C)–(F).
(G) BSE micrograph.
(H) Ca, Si, and Al EDS elemental maps.
(I) Clustering of the quantified EDS data.
(J) The elemental composition of the clusters in (I) plotted on a Ca/Si/Al ternary diagram for comparison.
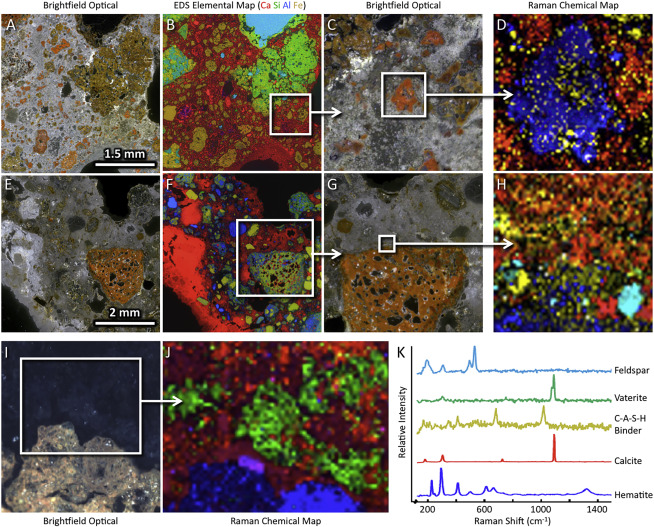
Figure 3. Raman analyses reveal the presence of C-A-S-H binder in the interfacial zone of the ceramic fragments
(A–D) Large-area optical micrograph (A), large-area EDS elemental map (B), and Raman imaging map (D) of mortar from the Aqua Alexandrina near Rome. The higher magnification optical micrograph in (C) denotes the region from which the Raman map in (D) was acquired.
(E–H) Large-area optical micrograph (E), large-area EDS elemental map (F), and Raman imaging map (H) of mortar from a cistern at the Baths of Caracalla in Rome. The higher magnification optical micrograph in (G) denotes the region from which the Raman map in (H) was acquired.
(I and J) Optical micrograph (I) and Raman imaging map (J) of mortar from an aqueduct near Rome.
(K) Raman spectra identified in (D), (H), and (J) colored according to the presented maps.
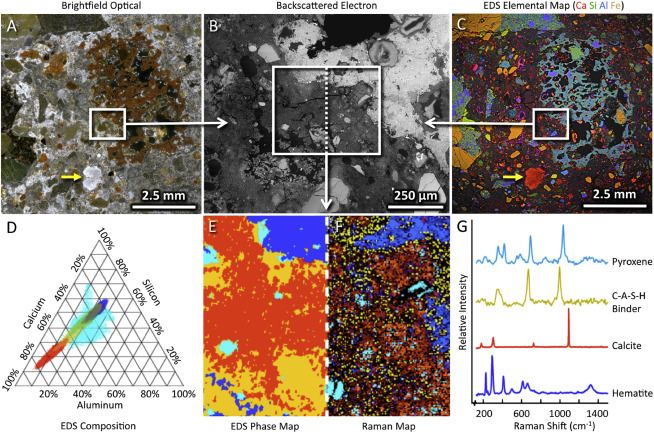
Figure 4. Correlative chemical imaging of mortar from an aqueduct leading into the archaeological site of Pompeii
(A–C) Large-area optical micrograph (A), a higher magnification backscattered scanning electron micrograph (B), and a large-area EDS map (C) of the same area shown in (A) of Pompeii aqueduct mortar. In this field of view, a lime clast (denoted by the small yellow arrows in A and C), a large porous ceramic fragment (brown in A, and teal in C), and its surrounding cement matrix are clearly visible.
(D) Quantification of EDS data from the full boxed area in (B) is clustered and plotted as a Ca/Si/Al ternary diagram, revealing the four major compositional groups within the sample.
(E–G) (E) Phase map of the clustered EDS data from (D), and (F) the Raman chemical map of the different components in (G) highlights the distribution of the C-A-S-H phase throughout the matrix, including near the volcanic material (pyroxene) and the ceramic fragment (hematite).
(G) Raman spectra from the full boxed area in (C) shows four components, including pyroxene, C-A-S-H binder, calcite, and hematite.
In designing new technologies that take inspiration from such ancient success stories, it is important to consider the target applications, just as the ancient engineers selectively used materials based on their specific performance metrics.
Admir Masic of MIT lead the research that was just published in Cell Reports Physical Science. Read it here.
Source of images: https://www.sciencedirect.com/